All Formulas 1RM Calculator
Compare all 7 one-rep max prediction formulas side by side — with formula metadata, reliability guidance, and an honest estimate spread.
Select an exercise and compare the estimates to see the suggested formulas.
Estimates can differ based on the formula, lift, and rep range.
Formula Spread
The spread shows how far apart the active formulas are. A smaller spread means the formulas agree more closely; it does not guarantee the estimate is correct.
Range: —
All Formulas — Ranked by Estimate
Results are sorted from highest to lowest estimate.
| # | Formula | Est. 1RM | vs Avg | Reliability guidance |
|---|---|---|---|---|
| Your formula comparison will appear here. | ||||
About the 7 Formulas
Formula, author, year, and commonly cited use case. Research findings vary by population, exercise, and testing method.
Epley · 1985
Author: Boyd Epley
1RM = weight × (1 + reps / 30)
A widely used linear estimate for strength training.
Common use: General use across many lifts, particularly moderate rep ranges.
Brzycki · 1993
Author: Matt Brzycki
1RM = weight × 36 / (37 − reps)
Frequently used for lower-rep strength estimates. Its equation becomes unsuitable at 37 reps.
Common use: Low reps, with caution as reps increase.
Lander · 1985
Author: J. Lander
1RM = 100 × weight / (101.3 − 2.67123 × reps)
A linear prediction equation that often gives results similar to other traditional formulas at lower reps.
Common use: Moderate rep ranges, with individual variation.
Lombardi · 1989
Author: Victor Lombardi
1RM = weight × reps0.10
A power-curve formula with a different response to increasing reps.
Common use: An alternative comparison estimate; verify against your own training data.
Mayhew · 1992
Authors: Mayhew et al.
1RM = 100 × weight / (52.2 + 41.9 × e−0.055 × reps)
Developed and studied in specific testing contexts, including bench-press research.
Common use: Compare with other formulas, especially in bench-press contexts; do not assume universal superiority.
O’Conner · 1989
Authors: O’Conner et al.
1RM = weight × (1 + 0.025 × reps)
A simple linear equation that is easy to calculate by hand.
Common use: A simple alternative estimate; it is not always the most conservative.
Wathan · 1994
Author: Dave Wathan
1RM = 100 × weight / (48.8 + 53.8 × e−0.075 × reps)
An exponential equation used to estimate maximal strength from submaximal sets.
Common use: Useful as one comparison across a range of reps; results still depend on the individual and lift.
Which Formula Should I Use?
There is no single formula that is most accurate for every person, lift, and rep range. Use these as starting points, then compare estimates with your actual training history.
- For 1–5 reps: Brzycki is a common choice for lower-rep estimates. Mayhew has also been studied in bench-press testing contexts.
- For 6–10 reps: Compare Epley and Wathan with other formulas to see whether estimates agree.
- For 11–20 reps: Treat all estimates with extra caution; endurance and individual rep capacity can affect predictions.
- When unsure: The average of the selected formulas provides a middle estimate, not a statistically validated guarantee.
Training Weights Based on Your Estimated 1RM
These percentages are calculated from the average of your selected formulas. Adjust loads to your training plan, technique, and recovery.
Want to plan exact percentages for your workout? Use the % of 1RM Calculator →
Important Accuracy Note
No formula is perfectly accurate. Individual variation, exercise selection, technique, fatigue, and training experience all affect real-world results. Treat calculated values as estimates, not a promise of performance.
Most one-rep max (1RM) calculators use a single mathematical formula to estimate your maximum lifting strength. However, different formulas can produce different results depending on the weight lifted, repetitions completed, exercise, and individual strength characteristics.
The All Formulas 1RM Calculator compares seven one-rep max estimation formulas simultaneously: Epley, Brzycki, Lander, Lombardi, Mayhew, O’Conner, and Wathan. Instead of relying on a single predicted maximum, you can compare each formula’s estimate, view the average of your selected formulas, and assess how closely the results agree.
Unlike a standard one rep max calculator that displays only one estimate, this all-formulas calculator focuses on comparison and transparency. Its interactive dot plot visualizes differences between predicted maximums, while formula-specific reliability guidance helps you interpret the results for your selected repetition count.
Whether you are calculating your bench press 1RM, squat 1RM, deadlift 1RM, or overhead press 1RM, this tool provides a detailed way to evaluate estimated maximum strength and make more informed training decisions.
The calculator can display the average estimated one-rep max, seven formula predictions, a visual estimate spread, and a ranked comparison table.
What Does the All Formulas 1RM Calculator Do?
The All Formulas 1RM Calculator brings seven one-rep max formulas together in one interactive tool. By entering your lifting weight and repetition count, you can compare estimated maximum strength values, identify differences between formulas, and explore exercise-specific guidance.
| Calculator Feature | How It Helps You |
|---|---|
| Average estimated 1RM | Displays the average of all active formulas, rounded to your selected weight increment. |
| Seven-formula comparison | Calculates your estimated one-rep max using Epley, Brzycki, Lander, Lombardi, Mayhew, O’Conner, and Wathan. |
| Interactive dot plot | Visualizes the range of formula predictions so you can see where estimates agree or differ. |
| Overall reliability rating | Summarizes the calculator’s configured criteria for the current repetition count and formula spread. |
| Ranked comparison table | Ranks the formula estimates and displays their differences from the average. |
| Exercise-specific recommendations | Highlights suggested formulas for bench press, back squat, deadlift, overhead press, and general lifting. |
| Interactive formula toggles | Lets you include or exclude formulas and recalculate the average and comparison. |
| Individual formula guidance | Shows configured reliability labels and notes about each formula’s common use cases. |
| Exercise selector | Updates the suggested formula guidance for your selected lift. |
| Repetition quick-select | Choose common repetition counts, including 1, 3, 5, 6, 8, 10, 12, 15, and 20 reps. |
| Weight units and rounding | Switch between pounds and kilograms and choose a preferred rounding increment. |
| Formula reference guide | Review the formulas, commonly cited authors and years, equations, and typical applications. |
| Training calculator link | Continue to the 1RM Percentage Calculator to plan training loads. |
| PDF export | Print or save a PDF of the available calculator results and reference information. |
The calculator’s main advantages are its visual formula spread and real-time formula selection. A single estimated maximum cannot show how much different formulas disagree. Displaying individual predictions alongside their average makes the uncertainty behind your estimated one-rep max easier to understand.
Why Compare All Seven 1RM Formulas?
Different one-rep max formulas use different mathematical relationships between lifting weight and repetitions completed. Comparing multiple methods provides a broader view of estimated strength than relying on one calculation alone.
The Limitations of Single-Formula 1RM Calculators
Many one-rep max calculators rely on a single formula, such as Epley, to estimate maximum lifting capacity. Although a single formula can be useful, its prediction may not be equally suitable for every exercise, repetition range, or lifter.
Epley is commonly used for general strength estimation. Brzycki is frequently applied to lower-repetition sets, while Mayhew’s formula has been studied in specific bench press testing contexts. Lander, Lombardi, O’Conner, and Wathan use different mathematical models and may produce different estimates from the same training set.
These differences matter because the relationship between repetitions and maximum strength is not identical for everyone. Training experience, fatigue, muscular endurance, exercise technique, and individual physiology can all influence performance.
A calculator that displays only one result does not show whether other established formulas produce similar predictions. Comparing seven estimates makes these differences visible and gives you more context when interpreting your estimated 1RM.
Why Use the Average of Multiple 1RM Formulas?
The All Formulas 1RM Calculator uses the average of the active formulas as its primary result. This provides a combined estimate rather than allowing a single formula to determine the entire outcome.
When multiple formulas produce similar estimates, their average offers a useful summary of the predictions. When the formulas differ substantially, the average should be interpreted more cautiously.
Important: Averaging formulas does not automatically guarantee greater accuracy. The formulas may share limitations, and their estimates are not necessarily independent. The average is best understood as a comparison-based estimate, not a verified measurement of your maximum lifting strength.
The calculator also lets you deactivate individual formulas. You can explore different combinations, compare estimates, and see how each formula influences the final average.
For a deeper understanding of the evidence, look for peer-reviewed research comparing 1RM prediction equations. Interpret each study according to the exercises, populations, testing methods, and repetition ranges it actually examined.
When Do 1RM Formulas Agree or Disagree?
The amount of variation between formula predictions depends partly on the number of repetitions used in the calculation.
For some commonly used formulas, lower-repetition sets produce more closely grouped estimates than high-repetition sets. As repetition counts increase, predictions may diverge because different formulas model the relationship between repetitions and maximum strength differently.
Low-repetition example
Several formulas may estimate similar maximums from a challenging three-repetition set. The relatively narrow spread indicates that the mathematical predictions are in close agreement.
High-repetition example
The same formulas may produce a wider range of estimates from a 12-repetition set. The larger spread signals greater disagreement between the mathematical models.
These examples illustrate formula agreement, not guaranteed real-world accuracy. A tight cluster does not prove that the predicted maximum is correct, and a wide cluster does not identify which formula is closest to the lifter’s actual maximum.
The interactive dot plot makes this distinction easier to understand. Instead of seeing only a single number, you can examine the range of predictions and decide how cautiously to use the result when planning strength training.
Compare individual estimates
See the predictions from active formulas and identify the highest, lowest, and average estimated maximums.
Understand the spread
Review the difference between estimates instead of assuming one calculated result is perfectly accurate.
Explore different formulas
Toggle formulas on or off to understand how the selected methods change the combined estimate.
Plan training more thoughtfully
Use the estimate as a reference point alongside your technique, recovery, and training experience.
How to Interpret Your Formula Comparison
After entering your weight and reps, review the average, individual predictions, and formula spread together. These values answer different questions and are most useful when considered as a group.
- Average estimated 1RM: The mean of the formulas currently selected in the calculator.
- Highest and lowest estimates: The upper and lower ends of the active formula predictions.
- Formula spread: The difference between the highest and lowest estimates. A larger spread means greater disagreement between the selected formulas.
- Deviation from average: Shows how far an individual formula’s estimate sits above or below the average.
- Reliability guidance: Provides context for interpreting a formula in the configured repetition range. It should not be treated as a universal scientific ranking.
Remember that agreement between formulas and accuracy against your actual maximum are two different things. To assess real-world accuracy, predictions must be compared with appropriately measured lifting results.
Plan Your Training Weights From Your Estimated 1RM
Once you have an estimated one-rep max, use it to calculate percentages for your training sessions. Your appropriate working weight will depend on your program, technique, and intended effort.
Final Thoughts on Comparing 1RM Formulas
Comparing the Epley, Brzycki, Lander, Lombardi, Mayhew, O’Conner, and Wathan formulas gives you more context than viewing a single prediction. The average summarizes the selected estimates, the comparison table highlights their differences, and the spread helps you judge how closely the mathematical models agree.
No formula is perfectly accurate for every lifter or exercise. Individual variation, lift type, repetition count, technique, fatigue, and training experience all affect real-world results. Use the calculator as a practical training reference, not a guarantee of your true maximum.
A safely performed heavy single with appropriate technique and suitable supervision provides a more direct measure of one-rep max strength than a mathematical estimate. When a true maximum test is not appropriate, formula-based estimates can still help you track progress and plan training more thoughtfully.
How to Use the All Formulas 1RM Calculator
The All Formulas 1RM Calculator helps you estimate your one-rep max from a completed lifting set and compare seven different prediction equations. Follow these steps to calculate your estimated maximum, review the formula spread, and understand how each prediction contributes to the average.
Step 1: Enter Your Lifting Weight and Repetitions
Enter the weight you lifted in the Weight Lifted field. Choose pounds (lb) or kilograms (kg), then enter the number of repetitions completed. You can use the quick-select buttons for 1, 3, 5, 6, 8, 10, 12, 15, or 20 reps, or type a valid repetition count directly.
For a more useful estimate, choose a challenging set performed with consistent technique. If you stop several repetitions before reaching your actual limit, a formula may underestimate your potential maximum. However, deliberately training to failure is not necessary for every workout and may not be appropriate for every lifter.
Select your preferred rounding increment and click Compare All Formulas. The calculator then applies each active equation to your input.
Step 2: Select Your Exercise
Choose Back Squat, Bench Press, Deadlift, Overhead Press, or General / Other. The exercise selector changes the calculator’s suggested formula guidance, helping you interpret the results in the context of your lift.
For example, the tool may highlight Brzycki and Mayhew for bench press, or Epley and Wathan for squat and deadlift. These are configurable recommendations rather than a guarantee that the highlighted formulas will be most accurate for every individual.
The best formula can depend on the population and exercise examined in the research, the number of repetitions performed, and your individual ability to complete repeated reps at a given percentage of your maximum.
Step 3: Review Your Average 1RM Estimate
After calculation, the results panel displays the average of your active formulas. This number summarizes the selected predictions; it is not a directly measured one-rep maximum.
Review the average alongside the highest and lowest estimates, the formula spread, and the individual formula results. If the predictions differ substantially, treat the average as a broader estimate rather than a precise target.
Step 4: Interpret the Reliability and Spread
The calculator’s reliability labels are intended to help you interpret the results. Repetition-based labels reflect configured guidance, while the spread shows how much the selected formulas disagree.
A narrow spread means the selected equations produce similar values. It does not prove that the estimate is accurate. A wide spread means the equations disagree more, so additional caution is appropriate.
Step 5: Toggle Formulas to Compare Different Estimates
Use the formula controls to include or exclude equations. The average should recalculate using only the active formulas. This lets you investigate how different equations affect your estimated maximum.
- Compare all seven: Review the full range of available formula predictions.
- Compare selected formulas: Explore how a smaller group of estimates changes the average and spread.
- Review higher-rep estimates: Pay particular attention to the stated use cases and limitations of each formula.
Selecting fewer formulas does not automatically improve accuracy. A smaller group is useful for comparison only when you understand why those equations are relevant to your situation.
Understanding the 1RM Formula Spread
Formula spread is the difference between the highest and lowest estimated one-rep max among the active formulas. It provides a straightforward way to see how much the mathematical predictions differ for the same lifting set.
How to Read a Formula Dot Plot
In a dot plot, each point represents an individual formula’s estimated maximum. The horizontal position indicates the estimated weight, so points close together represent similar predictions, while points farther apart represent a wider range of estimates.
If the chart also displays the average as a separate marker, that marker summarizes the active estimates. Inactive formulas may be shown in a faded style if the calculator has been built to retain their positions for comparison.
The chart’s appearance depends on the implementation of your live calculator. A simple range bar is not the same as a dot plot, and a faded point for an inactive formula should not be assumed unless the tool actually supports that behavior.
Narrow Formula Spread
The active equations return similar estimates. Their predictions are in close mathematical agreement, although the true maximum may still differ from all of them.
Wide Formula Spread
The active equations return noticeably different estimates. Interpret the average cautiously and consider using a challenging, technically consistent lower-repetition set when appropriate.
Formula Spread: Example Thresholds
The following table offers illustrative categories for describing differences between estimates. These are not universal scientific cutoffs, and the calculator should not describe them as validated confidence thresholds without supporting evidence.
| Spread Category | Illustrative Difference | Interpretation | Suggested Action |
|---|---|---|---|
| Narrow | Below 5% of the average | The selected formulas broadly agree. | Use the average as a planning reference while recognizing estimation error. |
| Moderate | 5%–15% of the average | The equations show a noticeable difference. | Review individual estimates and the context in which the formulas are used. |
| Wide | Above 15% of the average | The predictions differ substantially. | Treat the average cautiously and consider a more appropriate testing approach. |
Percentage spread is generally more useful than a fixed difference in pounds or kilograms because the same absolute difference has a different meaning for a 100 lb estimate and a 500 lb estimate.
Important distinction: A narrow formula spread indicates agreement between equations, not proven accuracy against a measured one-rep max. The spread is a measure of disagreement, not a statistical confidence interval.
The Seven 1RM Formulas: Complete Reference
The calculator compares seven equations commonly associated with estimating one-rep max strength from a submaximal lifting set. Each equation uses a different mathematical relationship between the weight lifted and repetitions completed.
| Formula | Commonly Cited Author | Year | Equation Type | Common Application |
|---|---|---|---|---|
| Epley | Boyd Epley | 1985 | Linear additive | General strength estimation |
| Brzycki | Matt Brzycki | 1993 | Linear denominator | Lower-repetition estimates |
| Lander | J. Lander | 1985 | Linear denominator | Comparison with other traditional equations |
| Lombardi | Victor Lombardi | 1989 | Power function | Alternative mathematical estimate |
| Mayhew | Mayhew et al. | 1992 | Exponential equation | Research contexts including bench press |
| O’Conner | O’Conner et al. | 1989 | Linear additive | Simple arithmetic comparison |
| Wathan | Dave Wathan | 1994 | Exponential equation | Alternative estimate across rep ranges |
Publication years, attribution, and validation ranges should be checked against the original publications or reliable secondary research before being presented as definitive. The commonly cited year is not, by itself, evidence that a formula is the most accurate for a particular exercise.
Epley Formula: A Common General-Purpose Estimate
The Epley equation is a widely used method for estimating one-rep max strength. It increases the estimated maximum in proportion to the number of repetitions completed.
Estimated 1RM = Weight × (1 + Reps / 30)
Coaches and lifters often use Epley for a quick estimate from a submaximal set. As with every prediction equation, accuracy depends on the lift, repetition count, effort, and the individual being tested.
Brzycki Formula: Estimating Maximum Strength From Lower Rep Sets
The Brzycki formula uses a denominator that changes with the number of repetitions. It is frequently used for lower-repetition strength estimates, but its output should not be extrapolated without caution beyond the range for which it is appropriate.
Estimated 1RM = Weight × 36 / (37 − Reps)
The denominator approaches zero as the rep count approaches 37, so the formula is not suitable for that boundary or for arbitrary high-repetition extrapolation.
Lander Formula: An Alternative Linear-Denominator Equation
Lander provides another traditional method for estimating one-rep max from weight and repetitions. Comparing its output with Epley and Brzycki can help illustrate how different equations respond to the same training data.
Estimated 1RM = 100 × Weight / (101.3 − 2.67123 × Reps)
Do not assume that one formula is more conservative or more accurate at a particular rep count without checking the calculation and the relevant validation evidence.
Lombardi Formula: A Power-Function Estimate
The Lombardi equation uses a power function rather than the same linear relationship used by Epley and O’Conner. This means its predicted maximum changes differently as the repetition count rises.
Estimated 1RM = Weight × Reps0.10
The formula is useful to compare as an alternative model. Whether its prediction is suitable for your lift should be judged from the context of your training and the relevant evidence.
See the Lombardi Formula guide .
Mayhew Formula: An Exponential Prediction Equation
Mayhew’s equation uses an exponential term to model the relationship between repetitions and predicted maximum strength. It has been investigated in particular testing contexts, including bench press research, but that does not establish universal superiority for every lift.
Estimated 1RM = 100 × Weight / (52.2 + 41.9 × e(−0.055 × Reps))
If you use Mayhew for squats, deadlifts, or other exercises, treat the result as a mathematical comparison unless you have evidence supporting its use for that specific context.
Read the Mayhew Formula guide .
O’Conner Formula: A Simple Linear Estimate
O’Conner’s equation uses a simple additive relationship, making it straightforward to calculate and compare with other formulas.
Estimated 1RM = Weight × (1 + 0.025 × Reps)
Although this equation may produce a lower estimate than some other methods for particular inputs, it is not guaranteed to be the lowest formula for every repetition count. Calculate the outputs rather than assuming a fixed ranking.
Wathan Formula: Another Exponential Estimate
Wathan uses an exponential equation that differs from Mayhew in its constants and curve. Comparing the two can help show how similar equation structures can still produce different estimates.
Estimated 1RM = 100 × Weight / (48.8 + 53.8 × e(−0.075 × Reps))
Wathan can be included in a multi-formula comparison, but its output should still be interpreted as an estimate rather than a verified maximum.
How to Interpret the Reliability Ratings
A reliability label can make a calculator easier to understand, but the meaning of the label must be clear. A category assigned by software is not automatically a validated scientific measure of prediction accuracy.
Overall Reliability by Repetition Count
| Repetitions | Example Label | Interpretation |
|---|---|---|
| 1–5 reps | High | A lower-repetition set may be a useful basis for estimation, depending on the formula and lift. |
| 6–10 reps | Moderate | Use the prediction with context and compare the active formula results. |
| 11–15 reps | Low | Individual repetition capacity may have a greater influence on the prediction. |
| 16–20 reps | Poor | Interpret the estimated maximum cautiously, especially if the formulas disagree. |
These categories are an illustrative software policy, not a universal scientific standard. Prediction accuracy varies by equation, population, exercise, and testing protocol. Lower rep counts can help reduce some sources of uncertainty, but they do not guarantee an accurate result.
What Does an Outside-Range Label Mean?
An Outside label can be used when a formula is being applied beyond a specified repetition range. The result may still be mathematically calculable, but it should not be interpreted as validated for that range without supporting evidence.
A robust calculator can keep these estimates visible for comparison while clearly identifying the limitation. Users should be able to distinguish between a calculation that can be performed and a prediction that has been validated for their situation.
For further background, consult the research on one-repetition maximum prediction equations, including this PubMed-indexed study . Verify that any specific statistic or conclusion used in your article accurately reflects the study’s methods and findings.
Exercise-Specific Formula Recommendations
Your selected lift can provide useful context for interpreting a predicted maximum. Some equations have been studied using particular exercises, while others are used more broadly. Recommendations should reflect the available evidence rather than implying that one formula has been proven best for every lifter.
| Exercise | Suggested Formulas | How to Interpret Them |
|---|---|---|
| Bench Press | Brzycki, Mayhew | Compare lower-repetition estimates and consider the bench-press contexts in which equations have been studied. |
| Back Squat | Epley, Wathan | Use these as comparison estimates and consider whether the evidence applies to your lifting population. |
| Deadlift | Epley, Wathan | Compare predictions without assuming that squat validation transfers directly to deadlifts. |
| Overhead Press | Epley, O’Conner | Use general estimation methods cautiously if exercise-specific validation is unavailable. |
| General / Other | Epley, Wathan | Compare multiple equations and review the spread rather than relying on a single recommendation. |
These combinations are suggested calculator settings, not a definitive ranking of scientific validity. Exercise-specific accuracy should be established from appropriate research and real-world validation.
Why Exercise Selection Matters
A repetition-based equation estimates maximum strength from a set, but different lifts involve different movement patterns, muscle groups, technique demands, and fatigue characteristics. A relationship observed in one exercise cannot automatically be assumed to apply equally to another.
Select the exercise that matches your training set, review the individual formula outputs, and use your training history to determine whether the estimated maximum is a reasonable planning reference.
Exporting Your 1RM Calculation and Planning Training Loads
Save Your Formula Comparison as a PDF
If the calculator provides a print or PDF export feature, use it to retain the input weight, repetitions, exercise, selected formulas, average estimate, and ranked results. A saved comparison can help you review estimates from different training sessions.
PDF contents depend on the calculator’s export implementation. Check the generated document to ensure it includes the information you need before sharing it with a coach or adding it to your training log.
Use Your Estimated 1RM to Calculate Training Weights
An estimated one-rep max can be used as a reference for calculating training loads at percentages of maximum strength. For example, a program may prescribe a percentage of 1RM for a working set, but the appropriate load also depends on the program, target effort, technique, and recovery.
Calculate Your Training Percentages
Continue from your estimated maximum to calculate weights for different training percentages.
Open the 1RM Percentage Calculator →
You can also explore the RPE Calculator to help contextualize prescribed loads with your perceived effort, if that tool is available on your site.
Accuracy Limits: What a 1RM Estimate Can and Cannot Tell You
A formula-based one-rep max is a prediction, not a direct measurement. Even if several equations return nearly identical values, they may still differ from the maximum you could actually lift under suitable testing conditions.
Factors that can influence the relationship between repetitions and maximum strength include training experience, fatigue, exercise technique, individual muscular endurance, and the effort used during the set. The same weight and rep count can therefore produce different levels of predictive accuracy for different people.
- Use consistent technique: Compare sets performed with a consistent range of motion and lifting standard.
- Record the context: Note the exercise, weight, reps, and how challenging the set felt.
- Compare trends: Use estimates from similar training conditions to monitor changes over time.
- Avoid treating estimates as guarantees: Do not attempt a maximum load solely because a calculator predicts it.
Bottom line: Comparing all seven 1RM formulas provides more transparency than displaying a single prediction. The average summarizes the active equations, and the spread reveals their disagreement. Neither measurement independently proves your true maximum lifting strength.
Frequently Asked Questions About the All Formulas 1RM Calculator
What is an all-formulas 1RM calculator?
It is a calculator that estimates one-rep max strength using multiple equations. This tool compares Epley, Brzycki, Lander, Lombardi, Mayhew, O’Conner, and Wathan and summarizes the active estimates.
Why do different 1RM formulas give different results?
Each formula uses a different mathematical relationship between lifting weight and repetitions. Because those relationships are not identical, the predicted maximum can differ even when the input set is the same.
Is the average of seven 1RM formulas more accurate?
Not necessarily. Averaging can summarize several predictions, but it does not automatically remove shared biases or guarantee that the result is closer to your actual maximum. Treat the average as a comparison-based estimate.
What does a wide formula spread mean?
A wide spread means the selected equations predict noticeably different maximums. This indicates disagreement between the models, not a precise measurement of the error in your true 1RM.
Which 1RM formula should I use for bench press?
Brzycki and Mayhew can be useful formulas to compare for bench press, but the most suitable equation depends on the repetition range and the evidence available for your particular context. Compare the estimates rather than assuming one is always best.
Can I use this calculator for squats and deadlifts?
Yes. Enter the weight and repetitions from your squat or deadlift set, then choose the matching exercise. The resulting values are estimates, and their accuracy depends on how well the equations apply to that lift and lifter.
Can I calculate my 1RM in kilograms?
Yes. Choose kg in the unit selector and enter the weight in kilograms. Make sure your input uses the selected unit before interpreting the result.
Can I use an estimated 1RM to plan workouts?
Yes. A predicted maximum can serve as a reference for calculating percentage-based training loads. Adjust those loads to your program, technique, readiness, and recovery rather than treating the estimate as an exact limit.
The All Formulas 1RM Calculator estimates your one-rep max (1RM) by comparing seven popular strength-training equations: Epley, Brzycki, Lander, Lombardi, Mayhew, O’Conner, and Wathan. Compare individual predictions, review the average, and understand how repetition count can affect your estimate.
Your one-rep max is the heaviest weight you can lift for one repetition with proper technique. An estimated 1RM can help you plan training loads, track strength progress, and calculate percentage-based workouts without regularly attempting a maximal lift.
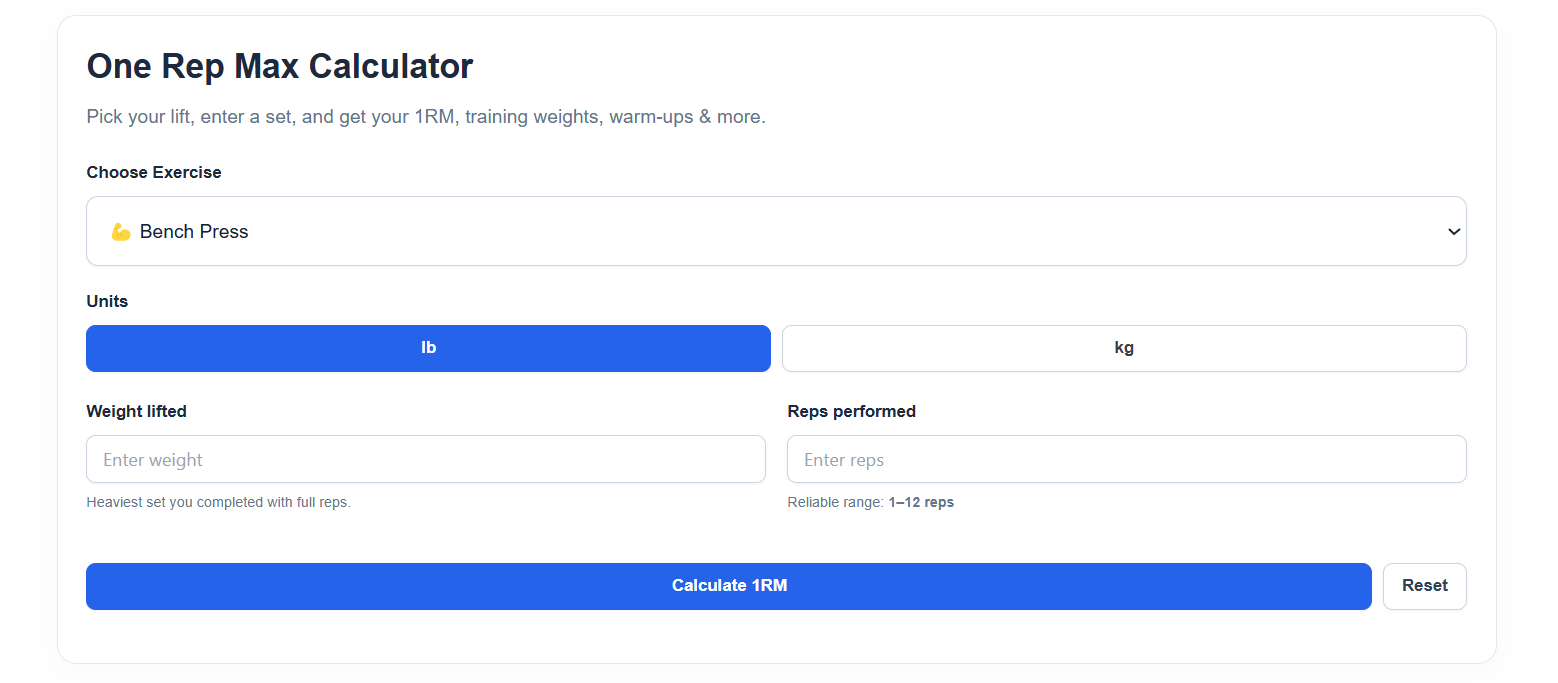
Start with the free One Rep Max Calculator and use this guide to understand the formulas behind your results.
How to Use the All Formulas 1RM Calculator
Use these steps to estimate your one-rep max, compare different prediction equations, and interpret the results for your strength training.
-
Enter Your Lifting Weight and Repetitions
Enter the weight you lifted and the number of completed repetitions. Choose pounds (lb) or kilograms (kg), depending on how you record your workouts.
For a more useful estimate, select a recent set completed with consistent technique and an effort level close to your actual repetition limit. A set stopped well before failure may not provide enough information to estimate your maximum reliably.
-
Select Your Exercise
If the calculator offers exercise selection, choose the lift that matches your set, such as bench press, back squat, deadlift, or overhead press. Exercise-specific recommendations can help organize your results, but they do not guarantee accuracy for every lifter.
-
Compare the Individual 1RM Estimates
Review the estimated maximum from each formula and compare the average with the individual results. If your tool provides a formula table, dot plot, or reliability label, use these features to understand how the equations differ.
Similar estimates show that the selected formulas agree with one another. They do not prove that the result equals your actual one-rep max.
-
Review the Formula Spread
Compare the highest and lowest predictions. A small difference indicates closer agreement between the selected equations, while a larger difference signals that the models are producing noticeably different estimates.
Formula Toggle Pills: Customize Your Average
Formula toggle pills let you select which equations contribute to the displayed average, provided this feature is implemented in the calculator. This can help you compare a smaller group of estimates without changing your original weight or repetition input.
How Toggling Changes the Average and Spread
When you deactivate a formula, it should be excluded from the average calculation if the calculator is designed that way. The displayed average and spread can then change to reflect the remaining active formulas. If the interface supports a dot plot, inactive formulas may also be displayed differently.
If the calculator prevents users from deactivating the last active formula, explain that behavior in the interface. Only describe real-time updates, animations, or specific visual effects if they actually work on your website.
Read more about the differences between the Epley and Brzycki formulas to understand why different equations can return different values.
Formula Combinations to Compare
- Bench press comparison: Compare Brzycki and Mayhew with other available equations. Consider the research context rather than assuming these formulas are best for every lifter.
- General strength estimate: Compare Epley and Wathan with the other predictions to see how the results vary.
- Higher-repetition sets: Interpret every result cautiously and check whether the equation has been validated for the repetition range you entered.
Exercise-Specific 1RM Formula Recommendations
The relationship between repetitions and maximum strength can differ across exercises and individuals. Use the following combinations as starting points for comparison, not as definitive rankings of scientific accuracy.
| Exercise | Formulas to compare | How to interpret them |
|---|---|---|
| Bench Press | Brzycki, Mayhew, Epley | Compare predictions and consider the exercise and repetition range represented in the available research. |
| Back Squat | Epley, Wathan, Brzycki | Use multiple estimates and compare them with your recent squat performance. |
| Deadlift | Epley, Wathan, Brzycki | Interpret results cautiously because equation performance can vary by lifter and testing conditions. |
| Overhead Press | Epley, O’Conner, Brzycki | Compare the estimates rather than assuming a formula is specifically validated for your lift. |
| General Strength Training | Epley and several alternatives | Use the range of predictions as a planning reference. |
Why Formula Choice Can Differ by Exercise
Some equations were developed or evaluated using particular exercises, participant groups, and testing protocols. Applying an equation outside that context may produce a useful estimate, but its accuracy should not be assumed to remain the same.
For general guidance, see the One Rep Max Calculator and compare its results with your own consistent training records.
Understanding the 1RM Formula Dot-Plot Spread
Formula spread describes the difference between the estimated one-rep max values produced by the selected equations. It helps you see whether several formulas return similar numbers or disagree substantially for the same lifting set.
How to Read the Dot Plot
In a horizontal dot plot, each dot represents a formula’s estimated 1RM along a weight scale. Dots grouped closely together indicate agreement between those predictions. Dots spread farther apart indicate greater variation between the equations.
Narrow, Moderate, and Wide Formula Spread
The categories below are illustrative explanations, not universally validated scientific thresholds. Use your calculator’s actual definition if it applies a different method.
| Spread category | Illustrative difference | Interpretation | Practical response |
|---|---|---|---|
| Narrow | Less than 5% of the average | The selected formulas return similar estimates. | Use the result as a starting point, not a verified maximum. |
| Moderate | 5% to 15% of the average | The equations show noticeable differences. | Review the individual predictions and your input data. |
| Wide | More than 15% of the average | The selected formulas disagree substantially. | Check the rep count, exercise, and relevance of the equations. |
These example percentages explain how spread might be described. They are not validated cutoffs for predicting actual one-rep max accuracy.
What Can Cause a Wide Formula Spread?
Equations use different mathematical relationships to estimate how performance changes as repetitions increase. Their predictions can diverge when the repetition count rises or when the lifter’s response differs from the assumptions used to develop a formula.
Remember that formula agreement is not the same as accuracy. Several equations can return similar estimates and still overestimate or underestimate your actual maximum.
The Seven 1RM Formulas Explained
The All Formulas 1RM Calculator compares seven commonly referenced prediction equations: Epley, Brzycki, Lander, Lombardi, Mayhew, O’Conner, and Wathan. Each estimates your one-rep max from the weight lifted and the number of repetitions completed.
In the equations below, w represents the lifted weight and r represents completed repetitions. Exponential equations use e, the mathematical constant.
| Formula | Equation | Key consideration |
|---|---|---|
| Epley | w × (1 + r / 30) | A commonly used general-purpose estimate. |
| Brzycki | w × 36 / (37 − r) | Interpret cautiously as repetitions increase; the denominator approaches zero near 37 reps. |
| Lander | 100 × w / (101.3 − 2.67123 × r) | Predictions depend on repetition count and the equation’s appropriate range. |
| Lombardi | w × r0.10 | A power-based alternative to linear equations. |
| Mayhew | 100 × w / (52.2 + 41.9 × e−0.055 × r) | Consider the exercise and population used in its validation. |
| O’Conner | w × (1 + 0.025 × r) | A simple additive estimate that may differ from other models. |
| Wathan | 100 × w / (48.8 + 53.8 × e−0.075 × r) | Accuracy depends on the lifter, exercise, and repetition range. |
Epley Formula
The Epley formula uses an additive relationship between the weight lifted and the number of repetitions. It is frequently used as a straightforward estimate for strength-training calculations.
Estimated 1RM = w × (1 + r / 30)For example, lifting 100 kg for five repetitions gives an estimated 1RM of approximately 116.7 kg with this equation. The result is a prediction, not a guarantee that you can lift that weight for one rep.
Brzycki Formula
The Brzycki formula uses a denominator that changes with the repetition count. It is commonly used to compare estimates from lower-repetition sets.
Estimated 1RM = w × 36 / (37 − r)The equation becomes mathematically unsuitable as the repetition count approaches 37. A calculable result should not be confused with a result validated by research.
Lander Formula
The Lander formula offers another relationship between lifted weight and repetitions. Comparing it with other equations shows how formula selection can affect your estimated one-rep max.
Estimated 1RM = (100 × w) / (101.3 − 2.67123 × r)Lombardi Formula
The Lombardi formula uses a power function rather than a simple additive relationship. Its predicted result can therefore differ from linear equations for the same set.
Estimated 1RM = w × r0.10Mayhew Formula
The Mayhew formula uses an exponential term to model the relationship between repetitions and estimated maximal strength.
Estimated 1RM = (100 × w) / (52.2 + 41.9 × e−0.055 × r)O’Conner Formula
The O’Conner formula is a simple additive equation that can be compared with the other available predictions.
Estimated 1RM = w × (1 + 0.025 × r)Do not assume it always produces the lowest estimate. Its result depends on the input and the other equations being compared.
Wathan Formula
The Wathan formula uses an exponential equation to estimate maximum strength from a submaximal set. Comparing its result with the other models can help you understand differences between predictions.
Estimated 1RM = (100 × w) / (48.8 + 53.8 × e−0.075 × r)No single formula is guaranteed to be the most accurate for every exercise, lifter, and repetition range. Use the estimates alongside your recent training performance and the evidence available for each equation.
1RM Calculator Reliability and Repetition Ranges
The number of repetitions in your input set can affect the usefulness of a one-rep max estimate. A formula may produce a number at many repetition counts, but its accuracy outside its studied range is not guaranteed.
| Repetitions | General interpretation | What to consider |
|---|---|---|
| 1–5 | Often useful for estimating maximal strength | Individual variation and formula error still apply. |
| 6–10 | Useful for many training applications | Estimates may vary across formulas and lifters. |
| 11–15 | Use greater caution | Individual repetition capacity can affect the prediction. |
| 16 or more | Interpret cautiously | High-repetition performance may be less representative of maximal strength. |
This table is general guidance, not a universal scientific reliability grading system. Actual reliability depends on the equation, exercise, participant, and validation method.
What Does “Outside” Mean in a Formula Table?
If your calculator labels a result as “Outside,” that should mean the entered repetition count is beyond the validity range configured for that formula. The calculator may still compute and display a result, but the output should not be treated as validated for that situation.
Check the original research before publishing exact validity limits for each equation. Do not describe an arbitrary software setting as a research-proven boundary.
How Accurate Is an All Formulas 1RM Calculator?
A multi-formula calculator estimates your one-rep max from a submaximal set. It cannot directly measure your maximum strength, and its output may differ from what you can lift in an actual test.
Several factors can influence the result:
- Exercise selection: Prediction accuracy may differ between bench press, squat, deadlift, and other movements.
- Training experience: Lifters can have different repetition capacities at similar percentages of their maximum.
- Effort and technique: Incomplete sets and inconsistent technique can affect the input.
- Fatigue and recovery: Readiness and training conditions influence performance.
- Formula choice: Equations use different mathematical models and research contexts.
How to Use Your Estimated 1RM for Training
Once you have an estimated one-rep max, you can calculate training weights based on percentages. For example, 70% of a 100 kg estimated 1RM equals 70 kg before rounding to available plates or adjusting for your training plan.
For safer programming, choose loads that match your current ability and goals. Do not use an estimated maximum as a reason to attempt an unsafe lift. Use appropriate technique, equipment, and spotting or safety arrangements where needed.
Exporting and Using Your 1RM Results
Export Your Results to PDF
If your calculator includes an Export PDF feature, it can be useful for saving a training record, reviewing changes between sessions, or sharing estimates with a coach. A useful report may include the input weight, repetition count, selected exercise, active formulas, individual predictions, and average estimate.
Only describe PDF export as available if the feature is implemented and working on your website. If the export runs entirely in the browser, you may explain that lifting inputs are processed locally only after verifying how the tool handles data.
Plan Training Percentages
Your estimated 1RM can be used as a starting point for percentage-based workouts. Visit the 1RM Percentage Calculator to calculate target loads from a maximum estimate, or use the RPE Calculator to help interpret training effort if those pages are available.
Frequently Asked Questions About the 1RM Calculator
What is an All Formulas 1RM Calculator?
It estimates your one-rep max using multiple prediction equations. Comparing their outputs helps you see how formula choice affects the predicted maximum instead of relying on only one equation.
Why do different 1RM formulas give different results?
Each equation models the relationship between weight and repetitions differently. Research populations, exercises, and testing conditions can also differ, so the same input may produce several estimates.
Is the average of seven formulas the most accurate result?
Not necessarily. The average summarizes the selected predictions, but it is not automatically more accurate than an individual equation or a properly conducted maximum-strength test.
What does a wide formula spread mean?
A wide spread means the active equations produce noticeably different estimated one-rep max values. It signals disagreement between the models, not a direct measurement of prediction error.
Which 1RM formula should I use for bench press?
Compare formulas such as Brzycki, Mayhew, and Epley, and consider the research relevant to bench press and your repetition range. No equation is guaranteed to be best for every lifter.
Can I use this calculator for squat and deadlift?
Yes, if the calculator accepts your lifting weight and repetition count for those exercises. Select the appropriate lift when the option is available and treat the result as an estimate.
Can I calculate my 1RM in kilograms or pounds?
Yes, if the calculator provides both units. Choose the unit that matches your recorded weight and check that the displayed result uses the expected unit.
What does “Outside” reliability mean?
It should indicate that the repetition count is outside the validity range configured for a particular equation. The result may still be calculated, but its accuracy in that range is not established by the label alone.
Should I test my actual one-rep max?
A properly conducted maximum-strength test measures performance under the conditions of that test, while a calculator predicts strength from a submaximal set. A direct test is not necessary for every training plan and should only be attempted when appropriate for your experience and safety setup.
Can I use an estimated 1RM to calculate training percentages?
Yes. An estimated 1RM can provide a starting point for percentage-based programming. Adjust working weights to your actual performance, technique, and training plan rather than treating calculated percentages as exact prescriptions.
The All Formulas 1RM Calculator lets you compare seven one-rep max prediction equations and explore how each formula affects your estimated maximum strength. Use formula toggle controls to customize the calculation, compare exercise-specific recommendations, review differences between estimates, and turn your results into practical training loads.
A one-rep max (1RM) is the maximum weight you can lift for one repetition with appropriate technique. When a direct maximum-strength test is not suitable, a calculated 1RM provides an estimate based on a submaximal set. Comparing Epley, Brzycki, Lander, Lombardi, Mayhew, O’Conner, and Wathan helps you understand how different equations interpret the same lifting performance.
Formula Toggle Pills: Customize Your 1RM Average
Formula toggle pills allow you to choose which one-rep max equations contribute to your result. Instead of calculating an average from every available formula, you can compare selected equations and examine how their predictions differ.
This feature is especially useful when you want to investigate a particular exercise, explore a smaller set of estimates, or understand why different 1RM calculators return different numbers.
How Toggling Changes the Average and Formula Spread
When you deactivate a formula, a calculator with interactive formula filtering removes that equation from the active average. Its dot may appear faded on the chart to distinguish it from the selected estimates. When you activate or deactivate a formula, the average, dot plot, and comparison table should update using the remaining active equations.
A well-designed interface can also require at least one formula to remain active. If the user tries to turn off the final active formula, the control can cancel the action and provide visual feedback.
Three Formula Combinations to Explore
1. Bench Press Formula Comparison
Select Brzycki and Mayhew to examine two equations often discussed in relation to bench press strength estimation. Compare their outputs with the full formula set, especially when you want to see whether the estimates cluster closely.
This combination is a comparison method, not a guarantee that the average is the most accurate possible bench press prediction. The appropriate equation depends on the research evidence, rep count, and individual lifter.
2. Conservative Estimate Comparison
Select O’Conner on its own to see the value produced by that equation. You can then compare it with the remaining formulas to determine whether it is lower or higher for your particular input.
Avoid assuming O’Conner always produces the lowest estimate. Formula rankings can change according to the weight and repetition count entered.
3. Higher-Repetition Formula Comparison
For sets of 10 or more repetitions, you can compare Mayhew and Wathan if their validated research ranges are relevant to your situation. Check the evidence behind each equation before treating a high-repetition prediction as dependable.
High-rep sets can introduce additional uncertainty because an individual’s muscular endurance does not always correspond closely to their maximum strength.
For another comparison of common prediction methods, read Epley vs. Brzycki: Comparing 1RM Formulas.
Exercise-Specific 1RM Formula Recommendations
The best formula to investigate can depend on the exercise and the repetition range. Some equations have been studied in particular lifting contexts, while others are used as general prediction models. Exercise-specific labels should therefore be based on verified evidence rather than treated as universal rankings.
Understanding the Formula Star System
If the calculator uses star icons to highlight recommended equations, those stars should indicate the site’s configured recommendations. They should not imply that the starred formulas have been proven more accurate than every alternative for all lifters.
| Exercise | Formulas to compare | Reason to compare |
|---|---|---|
| Bench Press | Brzycki, Mayhew, Epley, Wathan | Compare different prediction models and check which have relevant bench press validation evidence. |
| Back Squat | Epley, Wathan, Brzycki | Review several estimates and verify that the selected formula has relevant squat research. |
| Deadlift | Epley, Wathan, Lander | Compare general equations while accounting for differences in exercise technique and lifter characteristics. |
| Overhead Press | Epley, O’Conner, Brzycki | Compare general-purpose estimates and avoid assuming that bench press findings transfer directly to overhead press. |
| General / Other | Epley, Brzycki, Lander, Lombardi, Mayhew, O’Conner, Wathan | Use the full comparison to see how different mathematical models respond to your input. |
These are suggested comparison groups, not definitive scientific rankings. Verify exercise-specific validation claims before describing any formula as the most accurate for a particular lift.
Why Formula Recommendations Differ Between Exercises
The relationship between repetitions and maximum strength can vary by exercise, training background, and individual physiology. A formula developed or tested using bench press data cannot automatically be assumed to predict squat, deadlift, or overhead press performance with equal accuracy.
The same principle applies to high-repetition sets. A lifter’s ability to perform multiple repetitions depends on more than their maximum strength, so a prediction derived from a long set may differ from one based on a short, heavy set.
When choosing an equation, consider:
- The exercise and technique used in the original research.
- The repetition range studied in the validation sample.
- The characteristics and training experience of the participants.
- The difference between the formula’s prediction and measured performance.
- Whether your own training log supports the estimate.
Exporting and Using Your 1RM Calculator Results
Once you have compared the formula predictions, the next step is to save the result or use it to plan training. Export and cross-tool features depend on the calculator’s actual implementation.
Export Your One-Rep Max Results to PDF
If PDF export is supported, use the export control to create a record of your calculation. A useful 1RM report can include the weight lifted, repetition count, exercise, selected formulas, individual estimates, average, range, spread, and any reliability indicators shown by the tool.
A saved report can help you compare estimates across training sessions, maintain a strength-training log, or discuss your programming with a coach. If the export is generated entirely in your browser, your entered values may not need to be sent to a server; confirm this by checking how your particular calculator works.
Use Your Estimated 1RM to Calculate Training Weights
An estimated one-rep max can serve as a starting point for percentage-based strength training. For example, if your estimated 1RM is 100 kg, then 70% of that estimate equals 70 kg before adjusting for available plates and your program’s instructions.
The 1RM Percentage Calculator can help turn a maximum-strength estimate into training loads at different percentages. The RPE Calculator can complement percentage-based planning by helping you interpret perceived effort and adjust training according to your program.
Neither tool replaces sound programming or an assessment of your readiness on a particular day. Use the estimate alongside technique, fatigue, recovery, and training goals.
Technical Notes: Formula Validity Limits and Accuracy
What Does “Outside” Mean in the Formula Table?
Some calculators assign each formula an upper repetition limit based on a configured rule or the range supported by a particular research source. When an input exceeds that limit, the calculator may label the prediction as Outside.
An Outside label means the input is beyond the range that the tool treats as supported for that formula. The equation may still return a numerical result, but a calculable result is not necessarily a validated prediction.
If your calculator displays Outside-range estimates, keep the label visible so users can understand the limitation. If formula toggles are available, users can compare estimates from equations that are more relevant to their repetition range. The actual limits should be documented and supported by the original research or a clearly explained product rule.
How Accurate Are 1RM Prediction Formulas?
No formula can predict every lifter’s true one-rep max precisely. The difference between an estimated and measured maximum depends on the equation, exercise, rep count, technique, training experience, and individual ability to perform repeated efforts.
A fixed error claim, such as ±5–10%, should not be presented as a universal guarantee unless it is supported by evidence applicable to the specific formula, lift, population, and testing conditions. Prediction errors can fall outside that range.
Learn more about prediction uncertainty in our guide: How Accurate Are 1RM Calculators?
Frequently Asked Questions
What is the best formula for estimating a one-rep max?
There is no universally best equation for every lifter and exercise. Epley, Brzycki, Lander, Lombardi, Mayhew, O’Conner, and Wathan use different mathematical relationships. Choose a formula based on relevant validation evidence, the exercise, and your repetition range. Comparing several estimates can help you understand the variation between models.
Why do the formulas give different estimates for the same input?
Each formula uses a different equation to relate lifted weight to repetition count. Some use linear relationships, while others use power functions or exponential curves. These differences mean the same weight and repetitions can produce different predicted one-rep max values.
How can I get a more useful 1RM estimate?
Enter accurate lifting data, select the correct unit, and use a set performed with consistent technique and effort. Choose a formula with evidence relevant to your exercise and rep range. Compare the prediction with your training history, and remember that no calculator can guarantee your actual maximum.
What does the 1RM formula dot-plot spread tell me?
The dot plot shows how closely the selected equations agree. A narrow spread means the estimates are similar; a wide spread means they differ more substantially. Spread measures agreement among the selected formulas, not the exact error between an estimate and your true one-rep max.
Which formulas should I compare for bench press?
Brzycki and Mayhew are two formulas you can compare for bench press, alongside Epley, Wathan, and other available equations. Review the research context for each formula before assuming one is more accurate for your repetition range or training background.
What does Outside reliability mean in the formula table?
Outside indicates that the input is beyond the range treated as supported by the calculator’s configured rule. The equation may still produce a number, but that result should be interpreted cautiously because its accuracy may not have been established for that input range.
Is comparing seven formulas more accurate than using one formula?
Not automatically. A multi-formula calculator gives you more predictions to compare and can make disagreement visible. However, averaging several equations does not guarantee greater accuracy because formulas can share assumptions or produce similar errors.
Can I use my estimated 1RM to plan workouts?
Yes. An estimated one-rep max can help you calculate percentage-based training loads and monitor changes over time. Adjust your working weights to your technique, current performance, fatigue, and training plan rather than treating a calculated number as an exact prescription.
Can I change which formulas contribute to the average?
If the calculator includes interactive formula toggle controls, you can select or deselect equations to compare different combinations. The average should reflect the active formulas, and the interface should make inactive formulas visually distinct.